

#198: Why Droplet Size Controls Everything
Seeds, surfaces, and the math that decides whether clouds make rain - Part 2/15 of Water Phase transitions and climate repair


We start from where we left off in Part 1, with two questions about rain, one about aircraft and cloud seeding, another about fungi and biological aerosols, and a cascade of deeper questions about how precipitation actually forms.
Part 2 will answer some of these questions. Specifically, we’ll build the physics foundation you need to understand:
Why clouds need seeds at all (Section 2.1)
Where those seeds come from and why their size matters (Section 2.2-2.3)
Why small droplets can’t fall out of clouds (Section 2.4)
The two fundamentally different ways droplets can grow (Sections 2.5-2.6)
Why clean air makes rain easily while polluted air doesn’t (Sections 2.7-2.8)
The critical thresholds that separate rain from no-rain (Sections 2.9-2.10)
Once you understand how droplet size is controlled and why collision-coalescence needs size differences to work, the answers to both the aircraft question and the fungi question become clear and so do the deeper questions about when and how we might intervene.
Let’s start with the most basic puzzle:
2 | What Actually Makes a Droplet? OR Why won’t perfectly clean air just make clouds on its own?
2.1 The Seed Problem
Here’s something that puzzled early meteorologists: Water vapor should just condense into droplets when air gets cold enough, right? Cool the air below the dew point, and boom - cloud.
Except it doesn’t work that way. If you take perfectly clean air - no dust, no particles, nothing - and cool it down, the vapor just sits there. Supersaturated. Waiting. You can get relative humidities of 300-400% and still no droplets (Pruppacher & Klett, 1997, pp. 143-156).
This seems absurd. Why won’t the water condense?
The answer is surface tension. Water molecules at the surface of a tiny droplet are pulled inward by their neighbors, creating a curvature-dependent effect first described by Lord Kelvin - the smaller the droplet, the higher the equilibrium vapor pressure required to maintain it (Kohler, 1936; Pruppacher & Klett, 1997, Chapter 6). This makes it energetically unfavorable for molecules to join. They’d rather stay as vapor.
So clouds need seeds. Particles that provide a surface where condensation can happen without fighting this energy barrier.
We call them Cloud Condensation Nuclei - CCN (Twomey, 1959).
You can play with this small html code, just run it and see how it goes. Twomey effect - You can adjust the slider to change the size and concentration of the CCN and understand this intuitively, here’s a screenshot


2.2 The Aerosol Zoo
CCN come from everywhere, and understanding their sources is critical to understanding how human activities disrupt precipitation formation:
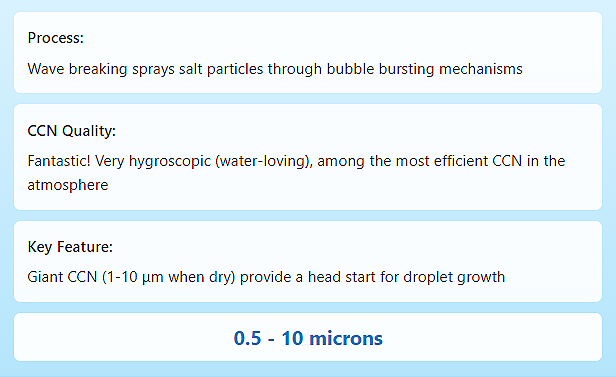
From the ocean:
When waves break, they spray salt particles into the air through bubble bursting mechanisms (Blanchard & Woodcock, 1980). These are fantastic CCN - very hygroscopic, meaning they love water. Marine aerosols are among the most efficient CCN in the atmosphere due to their high solubility (Lewis & Schwartz, 2004). Sizes range from 0.5 to 10 microns, with the size distribution dependent on wind speed and wave breaking intensity (Andreas et al., 1995; O’Dowd & de Leeuw, 2007).
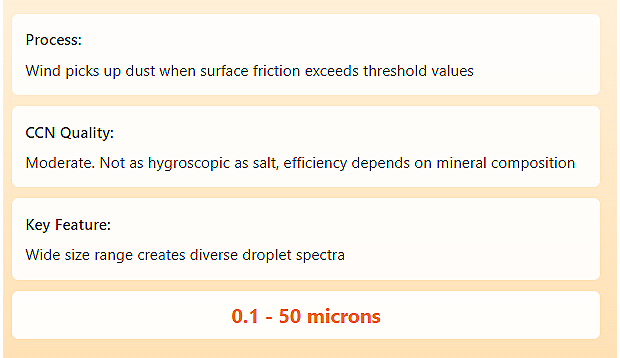
From the land:
Wind picks up dust when surface friction velocities exceed threshold values that depend on particle size and soil moisture (Gillette & Passi, 1988). Soil particles, mineral grains, anything fine enough to be lofted. These work okay as CCN but aren’t as hygroscopic as salt - their CCN efficiency depends on mineralogical composition and atmospheric processing (Koehler et al., 2009). Sizes: 0.1 to 50 microns, with the coarse mode dominating the mass but the fine mode dominating by number (Prospero et al., 2002).
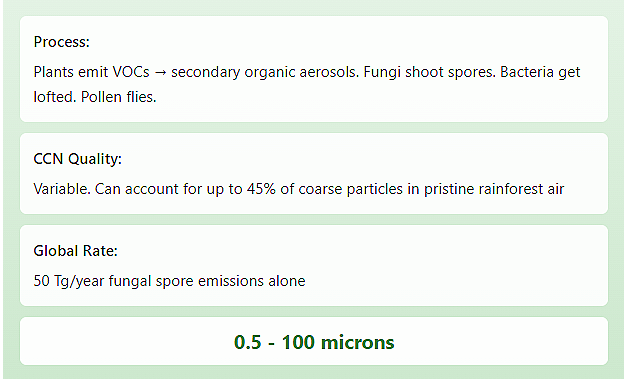
From life:
This is the interesting one. Plants release volatile organic compounds that undergo atmospheric oxidation to form secondary organic aerosols (Hallquist et al., 2009). Fungi shoot spores into the air - both actively through discharge mechanisms and passively through mechanical disturbance - with global emission rates estimated at 50 Tg/year (Elbert et al., 2007). Bacteria get lofted by wind, rain splash, and leaf movement (Lighthart, 1997). Pollen flies during species-specific flowering periods (Jones & Harrison, 2004). These biological particles range from 0.5 microns (bacterial cells) to 100 microns (large pollen grains) (Després et al., 2012). In pristine tropical rainforest air, biological particles can account for up to 45% of coarse particulate matter (Pöschl et al., 2010).
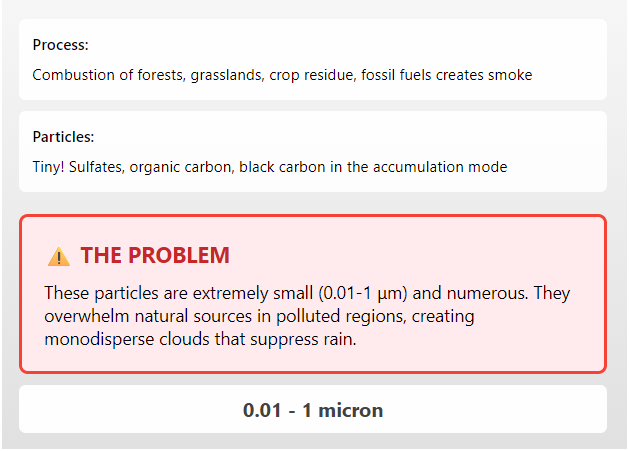
From burning:
And here’s the problem. When we burn things - forests, grasslands, crop residue, fossil fuels - we create smoke. Biomass burning produces complex mixtures of gases and particles, with emission factors varying by fuel type and combustion efficiency (Andreae & Merlet, 2001). The particles are tiny: sulfates, organic carbon, and black carbon (Bond et al., 2013). Mostly in the 0.01 to 1 micron range - the accumulation mode that dominates CCN concentrations (Reid et al., 2005). These combustion aerosols overwhelm natural sources in polluted regions.

2.3 The Arithmetic That Changes Everything
Let’s do some simple math.
Suppose a cloud has a certain amount of condensable water - say 0.5 grams per cubic meter of air. This water is going to condense onto whatever CCN are available. The water gets divided roughly equally among all the particles (the exact partitioning depends on particle size and hygroscopicity, but this is a reasonable first approximation; see Seinfeld & Pandis, 2006, Chapter 13).
If you have 100 particles per cubic centimeter, each droplet gets:
0.5 g/m³ ÷ 100 cm⁻³ = pretty good amount of water → larger dropletsIf you have 2,000 particles per cubic centimeter, each droplet gets:
0.5 g/m³ ÷ 2,000 cm⁻³ = much less water → smaller droplets
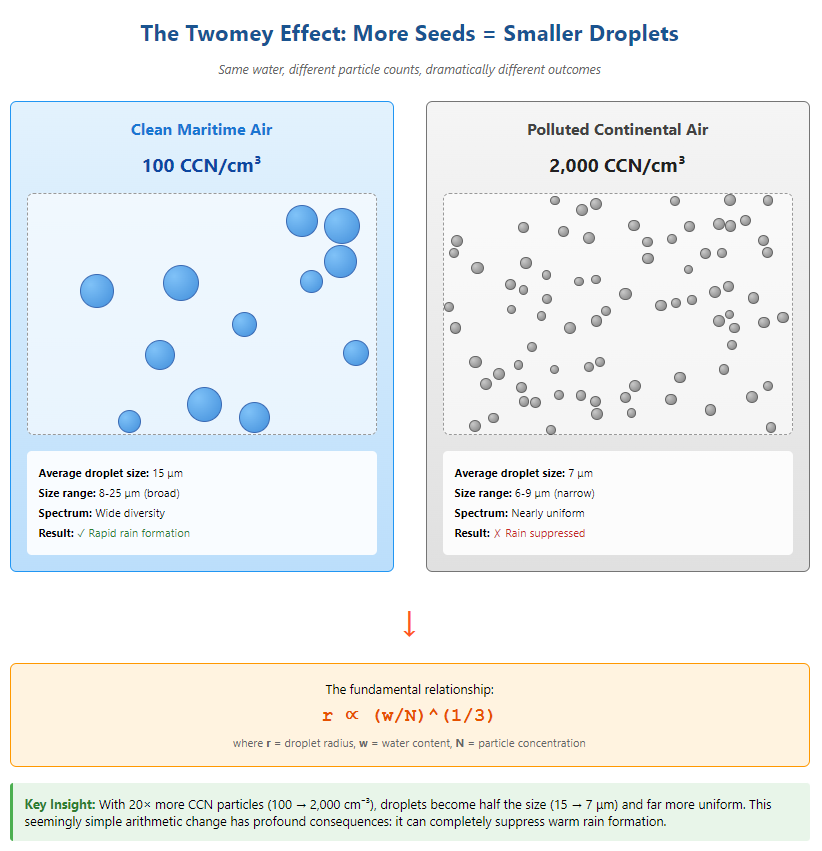
The exact relationship is cubic root (since volume goes as r³), but the pattern is clear:
r ∝ (w/N)^(1/3)
More seeds = smaller droplets.
This is the Twomey effect, named after Sean Twomey who systematized it in the 1970s (Twomey, 1974, 1977). This simple relationship has profound implications for precipitation efficiency.
Let me give you real numbers from field measurements:
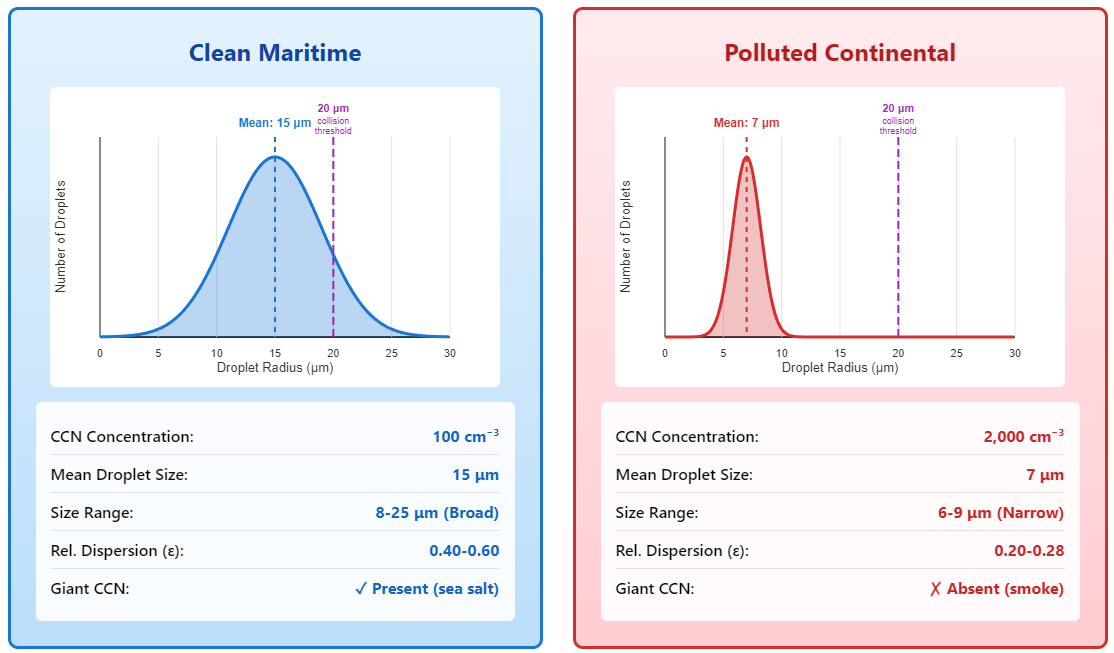
Clean maritime air (Hudson & Yum, 2001; Martin et al., 1994):
- CCN: 100 cm⁻³
- Droplet size: 15 μm average
- Size range: Broad - some droplets 8 μm, some 25 μm
Polluted continental air (Dusek et al., 2006; Andreae et al., 2004):
- CCN: 2,000 cm⁻³
- Droplet size: 7 μm average
- Size range: Narrow - most droplets 6-9 μmSame cloud. Same water. Twenty times more particles. Droplets are half the size and way more uniform. And here’s where it gets consequential: That size difference changes everything about whether the cloud makes rain.
2.4 Why Size Matters: The Fall Velocity Problem
Small droplets don’t fall. I mean, technically they fall, but so slowly it doesn’t matter.
The terminal fall velocity for a small droplet (less than 40 microns) follows Stokes’ law, first derived in 1851 (Stokes, 1851) and applicable when Reynolds numbers are low (Pruppacher & Klett, 1997, Section 10.3):
V_t = (2/9) * (ρ_w * g * r²) / μ
where:
ρ_w is water density (1000 kg/m³),
g is gravitational acceleration (9.8 m/s²),
r is droplet radius, and
μ is the dynamic viscosity of air (~1.8 × 10⁻⁵ kg/(m·s)).
That r² term is the key. Fall velocity goes as the square of radius.
Let me show you what this means in practice (calculated using Stokes’ law; see also Pruppacher & Klett, 1997, Table 10.1):
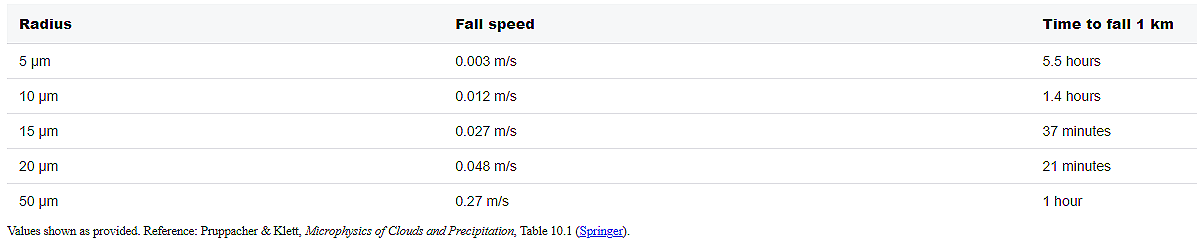
Notice what happens?
A 10-micron droplet takes 84 minutes to fall one kilometer. But typical updrafts in cumulus clouds are 1-10 meters per second (Jorgensen & LeMone, 1989; Lucas et al., 1994) - a hundred to a thousand times faster than the droplet falls.
The droplet isn’t falling. It’s trapped. It’s on an up-escalator that’s moving 100 times faster than it can walk down.
This is the fundamental problem of rain formation. Cloud droplets are prisoners of updrafts. They can’t escape by falling. They need another mechanism.
2.5 Growth Mechanisms: The Slow Road and the Fast Road
Droplets can grow by two fundamentally different processes, and understanding the difference is everything.
Mechanism 1: Diffusional growth (the slow road)
Water vapor molecules in the air randomly collide with the droplet surface and stick. The rate this happens depends on how much supersaturation there is and how easy it is for molecules to diffuse through the air.
The growth equation, derived from Fick’s law of diffusion and the heat balance at the droplet surface (Rogers & Yau, 1989, Eq. 7.26; Pruppacher & Klett, 1997, Eq. 13.3), looks like:
dr/dt = (C · S) / r
where C is a coefficient involving diffusivity and thermal conductivity, and S is supersaturation.
See that 1/r? Larger droplets grow more slowly (in radius increment per unit time). This tends to keep all droplets about the same size. Everyone grows together. Nobody gets ahead - a phenomenon called “spectral narrowing” (Liu et al., 1995).
Typical timescales for condensational growth (Pruppacher & Klett, 1997, Chapter 13):
1 to 10 μm: 5-10 minutes (fast)
10 to 20 μm: 30-60 minutes (slowing down)
20 to 50 μm: Several hours (getting really slow)
Mechanism 2: Collision-coalescence (the fast road)
When droplets fall at different speeds due to their size differences, the faster ones catch the slower ones. They collide. If they stick together (not guaranteed - we’ll get to that), the big droplet just got bigger (Beard & Ochs, 1993; Pruppacher & Klett, 1997, Chapter 14).
The growth rate by collision scales like:
dm/dt ∝ r²
Since mass goes as r³, this means:
dr/dt ∝ r²
Larger droplets grow faster. Way faster. This creates runaway growth - what Berry and Reinhardt (1974) called the “lucky droplet” mechanism. Big drops get bigger quicker, fall faster, catch more droplets, get bigger even quicker...
This is the mechanism that can produce rain on reasonable timescales. But - and here’s the catch - it only works if there are size differences to begin with.
The relationship can be seen in the following graph
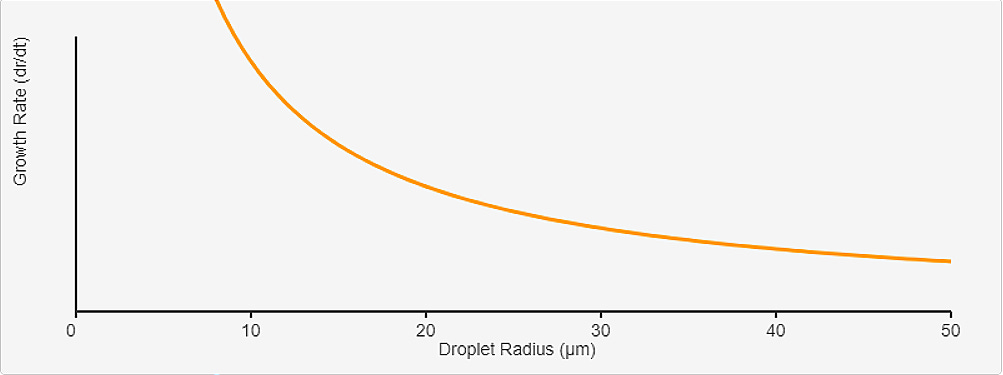
The Critical Difference: Diffusion equalizes droplet sizes (1/r dependence keeps everyone together), while collision amplifies size differences (r² dependence creates runaway growth). We need collision-coalescence to make rain, but it only works if we start with size differences. This is why the 19-21 μm threshold matters - it’s where collision takes over from diffusion.2.6 The Crossover: Where Everything Changes
There’s a critical size where the two mechanisms cross over: around 19-21 microns, though the exact value depends on droplet concentration and updraft velocity (Mason, 1971; Beard & Ochs, 1993).
Below 20 μm: Diffusion is the main game. Growth is slow and equalizing. Above 20 μm: Collision takes over. Growth is fast and amplifying.
Think of it like escape velocity. Below the threshold, we’re stuck in the gravity well. Above it, we’re accelerating away.
But here’s the problem: We can’t get to 20 microns by diffusion alone in any reasonable time. It takes too long, and diffusion actually slows down as we get larger.
We need a boost, i.e., we need to start larger, or get some lucky collisions early on when they’re small, or something - anything - to create size differences that let the faster droplets pull away.
But,
In clean maritime clouds, this happens naturally. Why?
2.7 Comparison Between Clean and Polluted Air
2.7.1 The Three Advantages of Clean Air
Advantage 1: Giant CCN
Sea salt particles can be 1-10 microns themselves - already large when dry (O’Dowd & de Leeuw, 2007). When water condenses onto a 5-micron salt grain, we immediately have a 10-micron droplet. It’s like starting halfway to the threshold. This “giant CCN” effect has been well-documented in marine clouds and can substantially accelerate warm rain formation (Rosenfeld et al., 2002; Andreae & Rosenfeld, 2008).
Advantage 2: Broad spectra
Clean air has a mix of particle sizes - small sulfates from marine DMS oxidation, medium dust, large salt, huge pollen grains (Heintzenberg et al., 2000). This creates a broad droplet size distribution right from the start. Some droplets are 8 microns, some are 20 microns. The 20-micron ones immediately start sweeping up the 8-micron ones.
Hudson & Yum (2001) measured this over the Pacific Ocean. Maritime clouds routinely show relative dispersions (σ/μ, the standard deviation divided by mean radius) of 0.4 to 0.6. That’s a broad spectrum.
Advantage 3: Lower droplet concentration
With only 100-300 CCN per cubic centimeter, there’s more water per droplet. Each one starts larger. And there’s more space between them - less crowding, easier for large drops to fall through and collect (Martin et al., 1994).
2.7.2 Disadvantages of Polluted Air
Disadvantage 1: Tiny CCN
Smoke particles are 0.05 microns. We start from effectively zero size. No head start (Reid et al., 2005).
Disadvantage 2: Narrow spectra
All the particles are about the same tiny size. So all the droplets end up about the same small size. Relative dispersion drops to 0.2-0.3. Almost monodisperse - what Liu & Daum (2002) call a “spectrally narrow” distribution.
Disadvantage 3: High concentration
With 1,500-5,000 CCN per cubic centimeter, every droplet is small, and they’re packed together. Hard for anyone to get ahead (Andreae et al., 2004).
The result? In a maritime cloud, we get embryo droplets (20+ microns) within 10-20 minutes. In a heavily polluted cloud, we might wait 60-120 minutes. Or forever.
2.8 Collision Efficiency: Not Every Encounter Counts
But wait - there’s another complication.
Even when a large droplet catches up to a small one, they don’t always merge.
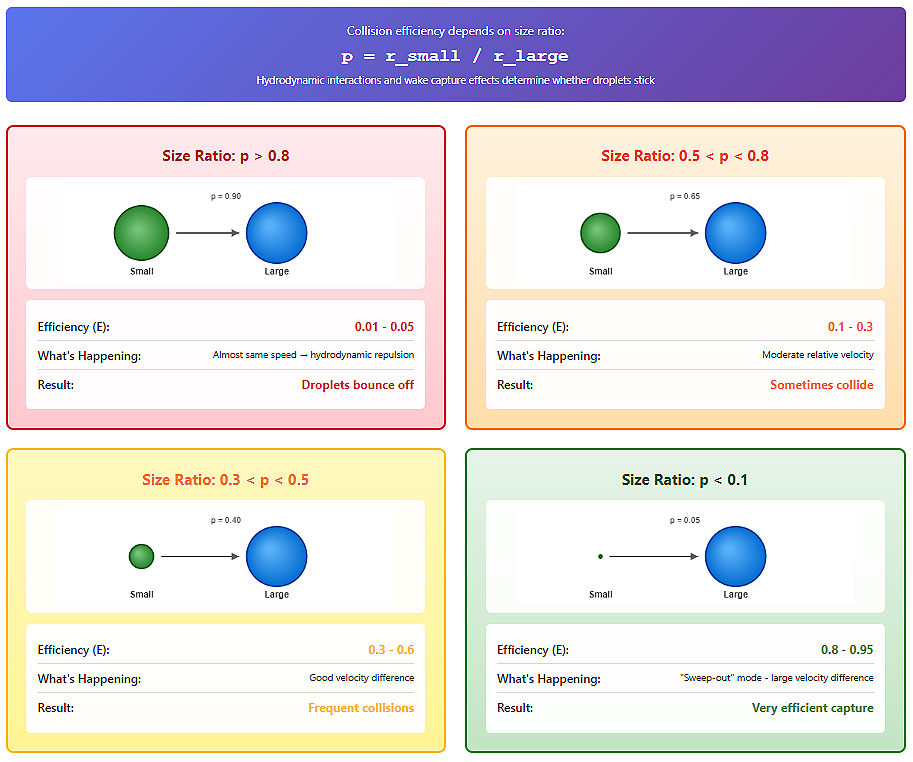
Collision efficiency E(r₁,r₂) depends on the size ratio p = r_small / r_large, and it varies dramatically due to hydrodynamic interactions and wake capture effects (Wang & Pruppacher, 1977; Pinsky et al., 2001).
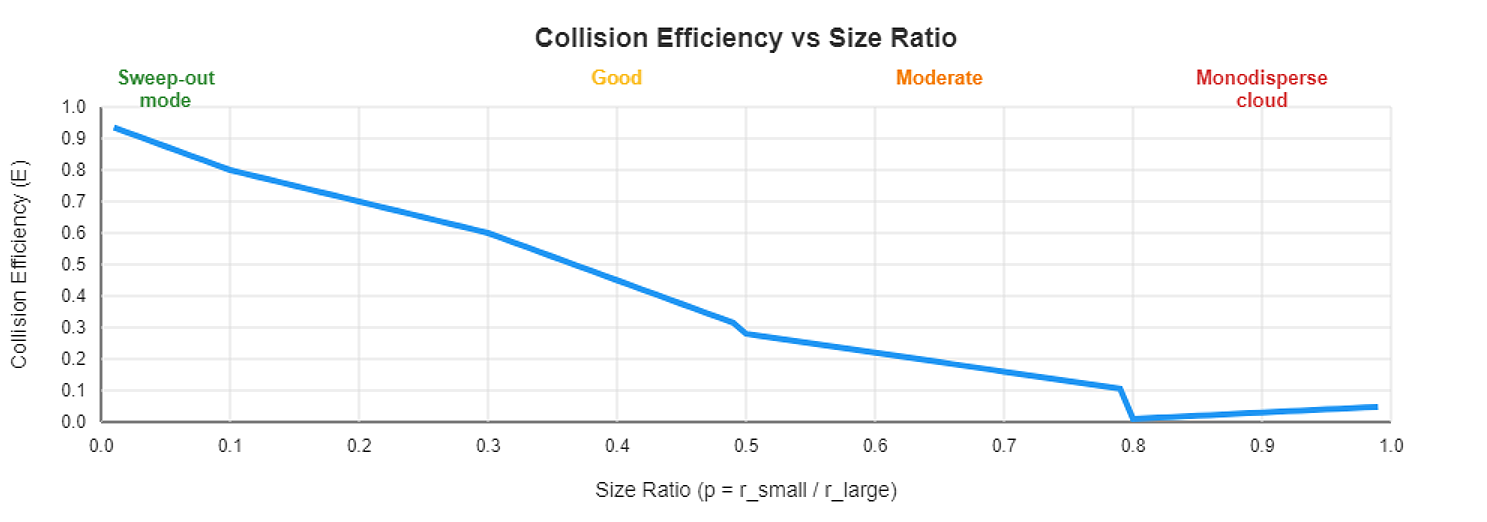
Here’s what Pinsky et al. (2001) found through detailed numerical simulations:
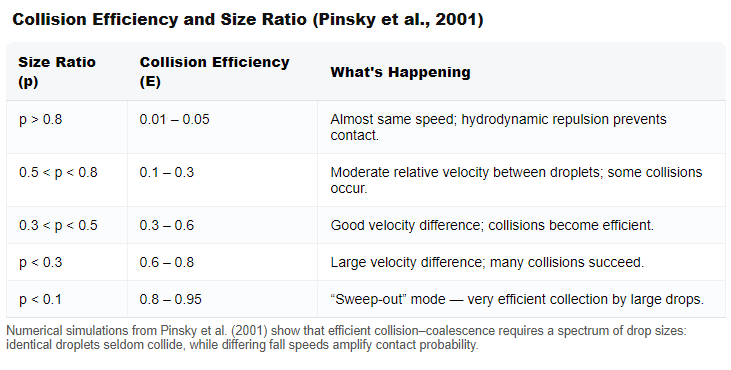
See the pattern? We need size differences for efficient collisions.
In a monodisperse cloud (all droplets the same size), p ≈ 1, and E ≈ 0.01. Collisions are rare and inefficient.
In a broad-spectrum cloud, p ranges from 0.1 to 0.5, and E averages 0.5-0.7. Collisions are frequent and efficient.
Liu & Daum (2002) quantified this beautifully using aircraft observations over the eastern United States. The autoconversion rate - the rate at which cloud water converts to rain water - scales as:
Rate ∝ ε^3.5
where ε is the relative dispersion (standard deviation divided by mean) of the droplet size distribution. This relationship has been confirmed in global climate models (Rotstayn & Liu, 2003). So, if we Go from ε = 0.45 (maritime) to ε = 0.22 (polluted):
(0.22/0.45)^3.5 = 0.09
The rain formation rate is reduced by 91 percent. Not because there’s less water. or the updrafts are weaker. but, because the spectrum is narrower.
2.9 The 15-Micron Gate
Okay, so we’ve talked about the 19-21 micron embryo threshold. But you keep hearing me mention 15 microns. What’s that about?
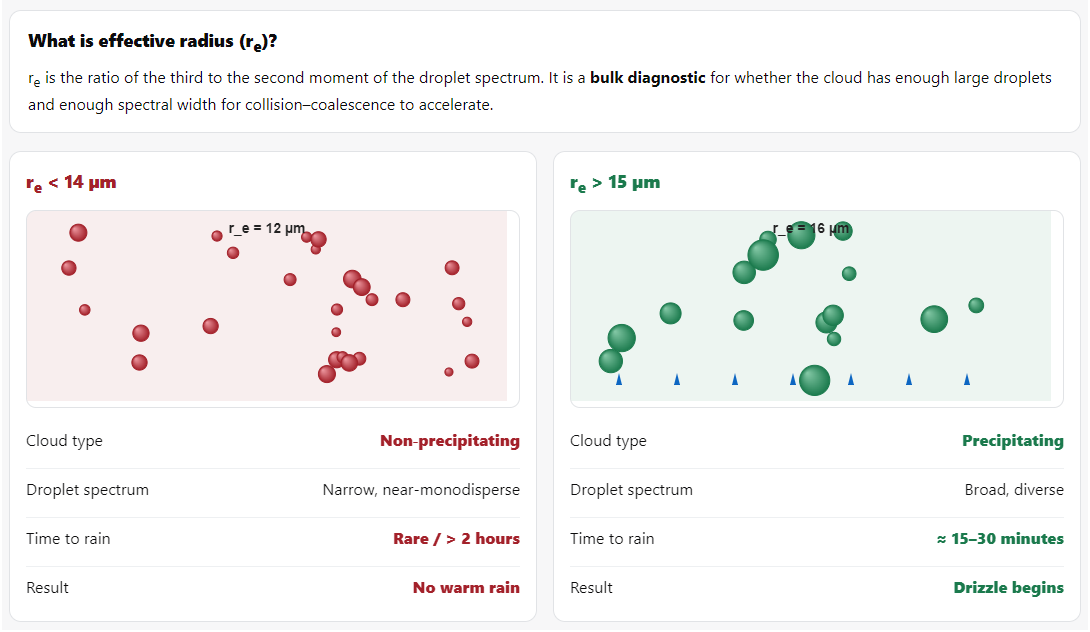
The 15-micron threshold is different. It’s not about individual droplets - it’s about the average droplet size across the whole cloud, called effective radius (r_e), defined as the ratio of the third to second moment of the droplet size distribution (Hansen & Travis, 1974).
Gerber (1996) was the first to really nail this down. He flew aircraft through marine stratocumulus off the California coast during the Monterey Area Ship Track (MAST) experiment, measuring droplet size distributions with a Forward Scattering Spectrometer Probe. He found that when effective radius exceeded 14-15 μm, drizzle started forming. Below that, nothing.
Lensky & Rosenfeld (2008) confirmed this using satellite data across thousands of clouds worldwide. They developed the CAPSAT (Clouds-Aerosols-Precipitation Satellite Analysis Tool) and found that the 14-15 μm effective radius threshold is incredibly robust across different cloud types and geographic regions.
What it’s telling us is: At r_e = 15 μm, the cloud has enough large droplets and enough spectral width that the collision-coalescence process can take off.
It’s a bulk property that predicts whether the microscale process (collision of individual droplets) will accelerate into macroscale precipitation.
Think of it as a diagnostic. If r_e crosses 15 μm, we’re almost certain to get rain within 15-30 minutes. If it stays below 14 μm for an hour, warm rain probably won’t happen.
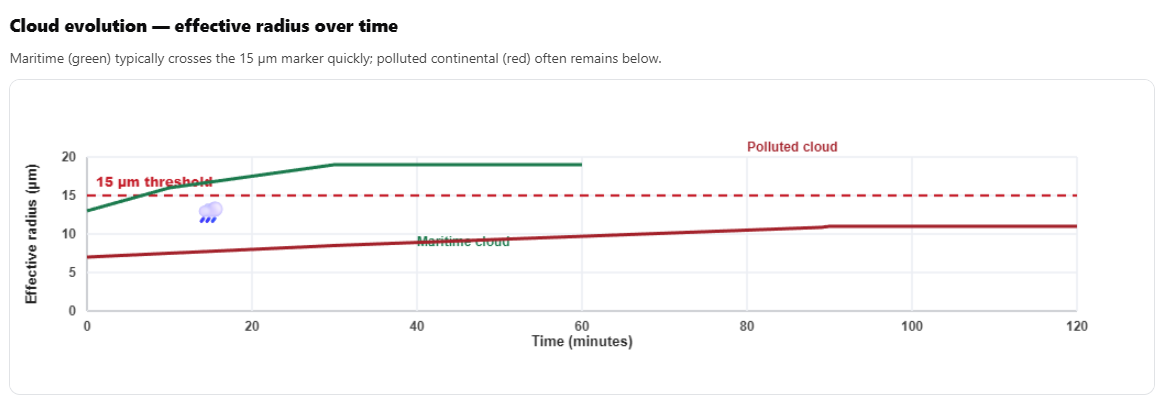
Why this threshold matters At re ≈ 15 µm the droplet field has sufficient size contrast for collisions to accelerate; around 20 µm coalescence often becomes self‑sustaining, given supportive dynamics. Use re as a predictive bulk marker for warm‑rain onset.2.10 The Regime Boundaries
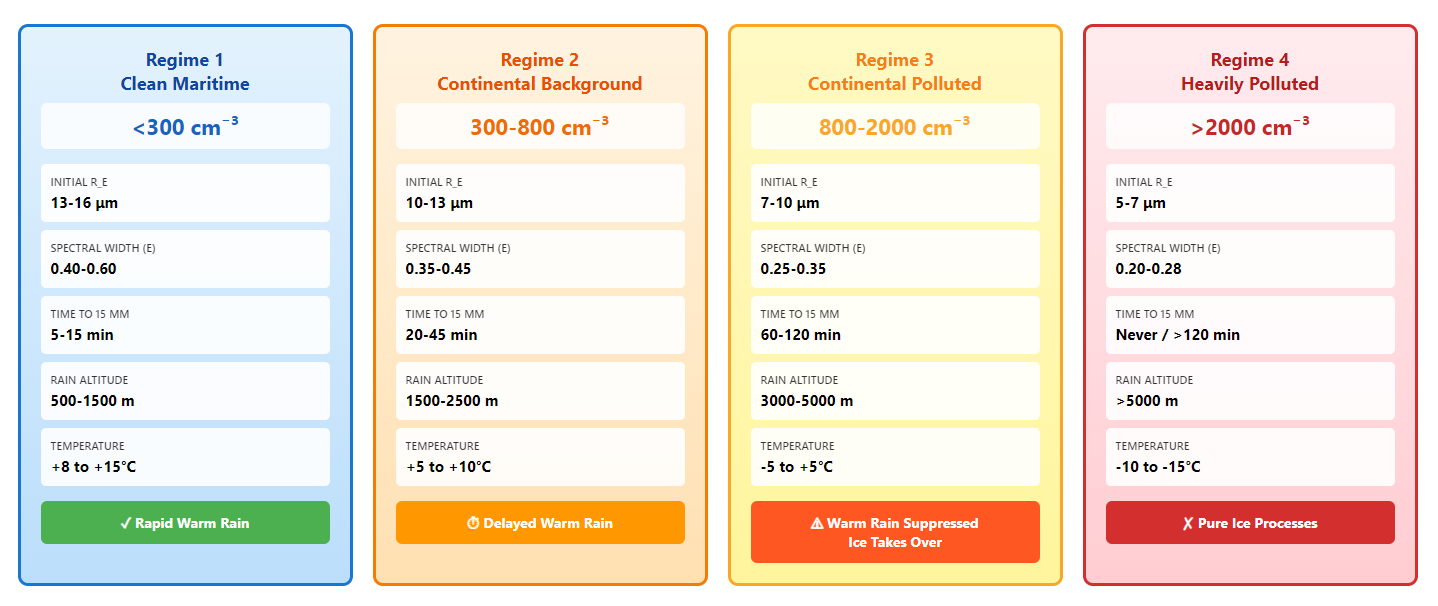
Let me summarize this in a table, because I find these regime boundaries clarifying (synthesized from Hudson & Yum, 2001; Martin et al., 1994; Andreae et al., 2004; Rosenfeld & Ulbrich, 2003):
Regime 1: Clean Maritime (N < 300 cm⁻³)
[Hudson & Yum, 2001; Martin et al., 1994]
Initial r_e: 13-16 μm
Spectral width ε: 0.40-0.60
Time to r_e = 15 μm: 5-15 minutes
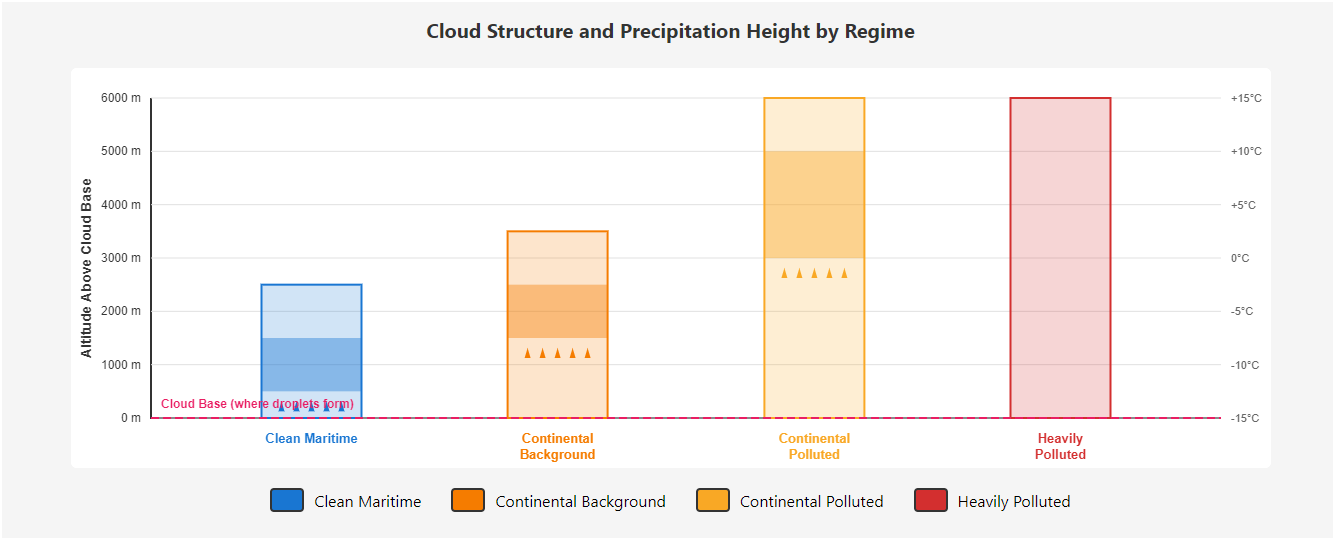
Warm rain altitude: 500-1500 m above cloud base
Temperature: +8 to +15°C
Result: Rapid warm rain
Regime 2: Continental Background (300 < N < 800 cm⁻³)
[Martin et al., 1994]
Initial r_e: 10-13 μm
Spectral width ε: 0.35-0.45
Time to r_e = 15 μm: 20-45 minutes
Warm rain altitude: 1500-2500 m
Temperature: +5 to +10°C
Result: Delayed warm rain
Regime 3: Continental Polluted (800 < N < 2000 cm⁻³)
[Andreae et al., 2004]
Initial r_e: 7-10 μm
Spectral width ε: 0.25-0.35
Time to r_e = 15 μm: 60-120 minutes
Warm rain altitude: 3000-5000 m
Temperature: -5 to +5°C
Result: Warm rain suppressed, ice takes over
Regime 4: Heavily Polluted (N > 2000 cm⁻³)
[Andreae et al., 2004; Rosenfeld et al., 2008]
Initial r_e: 5-7 μm
Spectral width ε: 0.20-0.28
Time to r_e = 15 μm: Never, or >120 minutes
Warm rain altitude: >5000 m or absent
Temperature: -10 to -15°C
Result: Pure ice processes
These aren’t theoretical. Andreae et al. (2004) documented exactly this progression in the Amazon during the Large-Scale Biosphere-Atmosphere (LBA-SMOCC) campaign. During fire season, CCN jumped from 400 cm⁻³ to 2,500 cm⁻³, and clouds stopped making warm rain entirely. All precipitation shifted to ice processes at high altitude.
Rosenfeld & Ulbrich (2003) showed the same pattern globally using Tropical Rainfall Measuring Mission (TRMM) satellite data combined with aircraft measurements, establishing this as a universal characteristic of aerosol-cloud-precipitation interactions.
Okay. Deep breath. That was a lot of physics. But now you understand what controls droplet size, why it matters, and what the thresholds are, and let’s end with this graphic to conclude.
Now let’s see what happens when you cross - or fail to cross - that threshold. Join me in the next episode, stay tuned.
PDF download (actionable summary) at the end — paid subscribers only.