

#217.1: When Pollen Becomes Rain
Water Phase Transitions and Climate Repair, Part 20.1: First Observational Evidence That Biological Giant CCN Control Rainfall Character

Episode 217 closed with a promise. The corridor framework rests on biological aerosol being a real and measurable controller of rainfall - not just a modelled one. Until last week, that link was a chain of modelling studies in good journals. Anyone with a sceptical bone could ask: where is the natural observation?
It is now in Islamabad.
This post walks through what the evidence is, how it was found, and what it changes about what restoration can be expected to deliver. The full paper is here: First Observational Evidence That Biological Giant CCN Control Urban Rainfall Character: A Natural Experiment from Islamabad’s Paper Mulberry Removal (2003–2025)
1 | The question no one had tested
For two decades the modelling literature has been building a case for biological aerosol as a controller of precipitation. Pollen acting as giant cloud condensation nuclei enhances warm rain in WRF-Chem simulations. Sub-pollen particles released by pollen rupture act as fine CCN through a competing pathway. Large-eddy simulations find that whole pollen grains as giant CCN increase liquid precipitation through collision-coalescence at concentrations above a few thousand grains per cubic metre.
Every one of those studies is a model.
None had been tested against observations of actual precipitation change resulting from a change in biological aerosol loading.
The field has been waiting for a natural experiment, and the reason it has been waiting is that finding one is structurally hard. In a normal city, urbanisation increases, fine anthropogenic aerosol increases, the urban heat island grows, evapotranspiration drops, and biological aerosol changes - all at once, over decades. Any rainfall change can be attributed to any of these four mechanisms. The signals co-vary in space and time. Attribution becomes inference with no leverage.
What is needed is a place where one of these variables - biological aerosol specifically - changes sharply while the others stay approximately constant.
That place is Islamabad.
2 | A city that ran the experiment for us
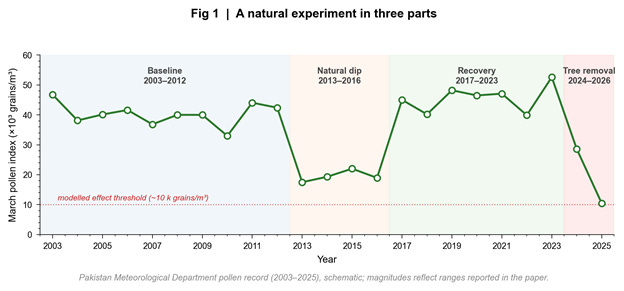
Islamabad was aerially seeded with paper mulberry (Broussonetia papyrifera) between the 1960s and 1980s. The species took over. By 2015, paper mulberry comprised roughly 90% of the urban canopy. By 2012, it produced roughly 94% of the city’s airborne pollen. Peak March concentrations reached 30,000-50,000 grains per cubic metre - among the highest pollen concentrations ever recorded anywhere on Earth, and three to four times the threshold at which the modelling literature predicts a precipitation effect.
This produced a public health crisis. Pollen allergy prevalence in Islamabad reached 45.8%. In November 2024 the Capital Development Authority began removing the trees. By February 2026, roughly 29,000 had been cut - about 36% of the estimated 80,000 paper mulberry trees in the city. The replacement species being planted - jacaranda, bauhinia, cassia, chir pine - contribute zero giant CCN during March, because they are either insect-pollinated or wind-pollinated with hydrophobic bisaccate grains released later in the year.
In atmospheric-science terms, this is a step-change perturbation to one variable. Pollen drops sharply. Canopy area, urbanisation, fine anthropogenic aerosol, heat island intensity - all keep doing what they were doing, gradually. The signal becomes separable.
Plus a bonus: within the 2003-2025 pollen record there is a natural dip from 2013-2016, when unfavourable spring weather suppressed pollen production despite no tree removal, followed by a recovery from 2017-2023, when pollen rebounded despite ongoing urbanisation. That is a second quasi-experiment inside the same dataset. The deliberate removal and the natural variability give two independent windows on the same question.
And there is a spatial control. Rawalpindi sits 15 km southeast of Islamabad. It experiences the same synoptic-scale forcing - the western disturbance storm systems that bring most of the region’s March rainfall pass over both cities. But Rawalpindi has a different tree composition, lower paper mulberry density, and no targeted removal campaign. Anything that changes in both cities is regional. Anything specific to Islamabad is local - which, given everything else that has been controlled for, points to the biological aerosol.
This is exceptional. Atmospheric science has very few experiments this clean.
3 | The diagnostic move
Most urban precipitation studies ask: did total rainfall change? That is the wrong question, because every candidate mechanism affects total rainfall to some degree, and the effects partially cancel in confounded ways.
The diagnostic move in the Islamabad paper is to ask a sharper question: did the kind of rain change?
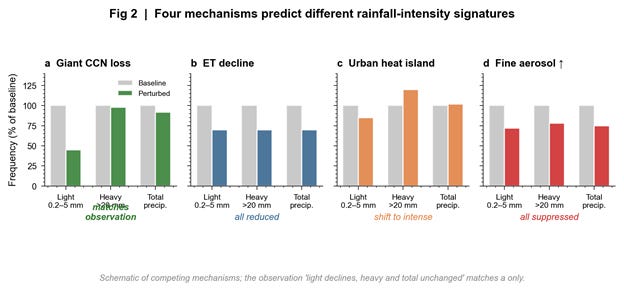
Four candidate mechanisms predict different things about the rainfall intensity distribution:
Giant CCN loss predicts loss of light rain specifically. Light rain in this regime comes from shallow warm cloud where collision-coalescence is the only pathway to precipitation. Lose the giant CCN and you lose the large collector drops that initiate coalescence. The light rain pathway closes. Heavy rain, which comes from deep convection accessing ice-phase pathways, is unaffected.
Evapotranspiration decline predicts proportional loss across all rain types. Less moisture, less precipitation, no intensity-specific signature.
Urban heat island intensification predicts a shift from weak to intense events. Higher CAPE, more explosive release. The heavy tail of the distribution grows; the light tail does not.
Fine anthropogenic aerosol increase predicts either suppression across all intensities (more small particles compete for vapour, narrowing the droplet spectrum) or invigoration of deep convection. Neither produces a light-rain-only signature.
These predictions are testably different. The observation “light rain declines, heavy rain unchanged, total precipitation constant” is uniquely consistent with giant CCN loss. The other three each predict patterns that should be visible at other intensities and aren’t.
This is, to the paper’s knowledge, the first use of rainfall intensity partitioning as a formal mechanism-discrimination tool in urban precipitation studies. Existing approaches - spatial controls, temporal controls, trend analysis - can constrain mechanisms but not separate them. Intensity partitioning separates them, because the mechanisms make different predictions at different intensities.
4 | What the data showed
Twenty-three years of monthly pollen counts from the Pakistan Meteorological Department. Forty-three years of daily rainfall from CHIRPS for Islamabad and for Rawalpindi.
Six tests.
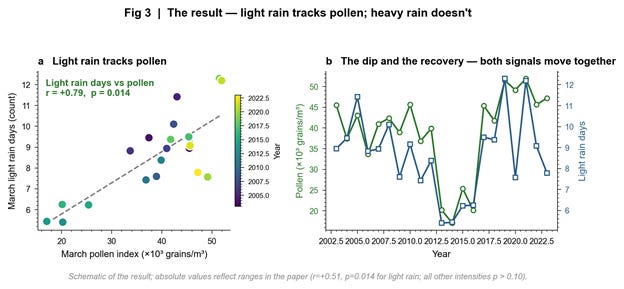
Light rain days (0.2-5 mm events) correlate with pollen at r = +0.51, p = 0.014.
Heavy rain days (>20 mm events): p = 0.17. No correlation.
Total precipitation: p = 0.60. No correlation. Mean rain intensity: p = 0.76. No correlation.
The effect is confined to March - the pollen season. The other eleven months show no relationship between pollen and any rainfall metric, which is the right behaviour: pollen is only present in atmospherically meaningful concentrations during March, and that is the only window in which the mechanism can operate.
The light-rain-only signal tracks the year-to-year pollen variability - including the 2013-2016 natural dip when light rain frequency also dropped, and the 2017-2023 recovery when it returned. Neither pattern correlates with canopy area or urbanisation, both of which monotonically increased through the period. The signal is not a slow trend; it follows the pollen signal specifically.
And in Rawalpindi - the control city, 15 km away, same storms, different trees - the same six tests give no significant correlations.
The giant CCN hypothesis passes all six tests. The other three each fail multiple tests. The intensity-partitioning machinery turns a question that has been confounded for half a century into a clean discriminator.
5 | Why prior aerobiology missed this
There is one more subtle thing worth understanding, because it explains why this signal has been hiding in plain sight in aerobiology data for years.
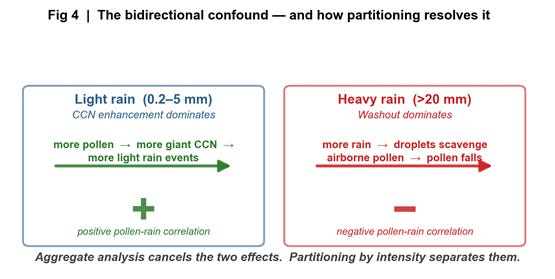
If you take a pollen time series and a rainfall time series for any city and just compute their correlation, you usually get a negative number. Rain scavenges pollen - droplets falling through the atmosphere collect pollen grains and bring them to the ground. The negative correlation is well-documented, and the aerobiology literature has interpreted it as the dominant causal direction: rain reduces pollen.
But the modelling literature predicts the opposite causal direction: more pollen produces more rain, via giant CCN. If both effects operate at once, they partially cancel in any aggregate analysis. The resulting correlation looks weak or null, not because there is no signal, but because there are two opposite signals fighting each other.
The intensity-partitioning move resolves this. Washout dominates during heavy rain - mechanical scavenging is most efficient when droplets are large and abundant, above roughly 10 mm. CCN enhancement dominates during light rain - those are the events whose existence depends on collision-coalescence being initiated by giant nuclei in the first place. The two causal directions live in non-overlapping intensity ranges. Partition by intensity, and the two signals stop cancelling each other.
This is the methodological contribution that makes the rest of the paper possible. The natural experiment was the opportunity. Intensity partitioning was the lens that made the opportunity legible.
6 | What this changes for Episode 217
This is the keystone the corridor framework has been missing.
Episode 217 argued that location matters for restoration: that the right corridor produces detectable rainfall change, and that the wrong location produces little. The whole argument depended on biological giant CCN being a real and measurable controller of rainfall, not just a modelled one. That link is no longer just modelled.
There is a second thing the Islamabad result clarifies, which is what a restored corridor actually delivers. The paper does not show that pollen increases total rainfall. It shows that pollen specifically increases light rain events while leaving heavy rain and total millimetres unchanged.
For a restoration funder reading Episode 217, this is a more honest and ultimately stronger framing of what to expect.
Restoration shifts the character of the rainfall regime - more frequent light rain events, more of the rainfall arriving in the form that infiltrates rather than runs off, more of the seasonal water budget spent on soil moisture rather than on a single high-intensity event. In semi-arid agriculture, light rain days are more useful than total precipitation. A regime with more light days is a regime in which crops actually get water at the times and intensities they can use it.
The Maestrazgo case in Section 9 of Episode 217 should be read against this. The leverage map identifies where the corridor effect would be strongest. The Islamabad paper specifies what that effect actually is: a shift in rainfall character, concentrated in the season when biological aerosol is active. Both pieces of evidence point in the same direction. Together they describe a real, measurable, location-specific intervention.
7 | What is portable
The Islamabad experiment was unusually clean in two ways: a single species dominating the urban pollen budget, and a sharp policy intervention removing that species. Most basins do not have a setup that tidy.
But the diagnostic move is portable. Anywhere there is a multi-decade pollen record and a co-located rainfall record, intensity partitioning can be applied. Anywhere there is a planned restoration or a documented loss, the same six tests can be run. The methodology travels.
Two settings where it would land cleanly.
Mediterranean basins with strong seasonal pollen cycles - including the Valencia-Maestrazgo system that Episode 217 used as its worked example. The pollen records exist, the rainfall records exist, restoration interventions are being planned. The opportunity to test the mechanism during the restoration, rather than after, is rare and worth taking.
Boreal forest fire recovery zones, where fungal communities collapse after fire and rebuild over 30-60 years. The biological aerosol signal is on a different timescale but the same logic applies. Recovery should show up first in light rain frequency, not total precipitation.
These are not idle suggestions. They are the natural follow-ups, and they are where this work goes next.
8 | A footnote on the asymmetry
There is one observation worth flagging before this post closes, which the synthesis episode will pick up in full.
Engineered atmospheric intervention - cloud seeding, marine cloud brightening, aerosol injection - is structurally unverifiable in the convective systems most often targeted, because the natural variability signal is indistinguishable from the intervention signal. Episode 211 in this series made that case in detail.
The Islamabad paper makes the opposite case for biological intervention. By operating in a non-convective regime (shallow stratiform cloud from passing western disturbances) and using intensity partitioning to separate mechanisms, the biological signal becomes detectable. The verification that engineering does not have, restoration may have.
That asymmetry is the through-line of the synthesis post that closes the series.
Next: Episode 217.2 — Ecological Statecraft. The Carnegie Endowment piece, co-authored with Olivia Lazard, that puts the regional security frame around basin-scale ecological restoration.
There is a bit of discrepancy in 2020 and 2022 but the next couple of years with continued removal will prove the hypothesis. With the fertilizer shortage currently in Australia farmers are shifting crops with different pollen rupture rates maybe this could also offer grounded proof? as the scale will certainly be large enough. Looks like the shift will be toward canola and pulses and legumes all with moderate to strong giant CCN potential.